As a developer, operator and owner of wind farms, Windlab Ltd (ASX:WND) is at the forefront of the transition towards renewable energy. So how does Windlab stack up as an investment?
Results
On the surface, today’s results are unimpressive, with revenue down 65.6% to $1.8 million. The loss-per-share (EPS) was 2 cents and the net loss after tax was $1.3m. Cash flow was weak too, with an operating cash outflow of $4.8 million and free cash outflow of $4.0 million. The company’s funding position remains healthy with $8.3 million cash, against $2.9 million of debt. There is also $92 million of borrowings held by the Kennedy Phase 1 project special purpose vehicle (SPV). The SPV is 50% owned by Windlab and the debt is non-recourse to the company.
Founded in 2003, Windlab is a young company and until 2012 it was purely a developer of wind farms. Development involves taking a project from inception up to the point at which construction is ready to start. It can take three to seven years to develop a project and success typically means the project acquirer pays the developer a development margin. This fee is often multiples of the cost of the development process. This means that development revenue is lumpy and the fact that none of Windlab’s projects reached financial close during the first half of 2018 is reflected in today’s results. In the second half of the year the 100 megawatt (MW) Lakeland project should reach financial close, and so the full-year result will probably look much healthier.
Zooming out, there is more evidence of progress, hinted at by the uplift in recurring income during the half.
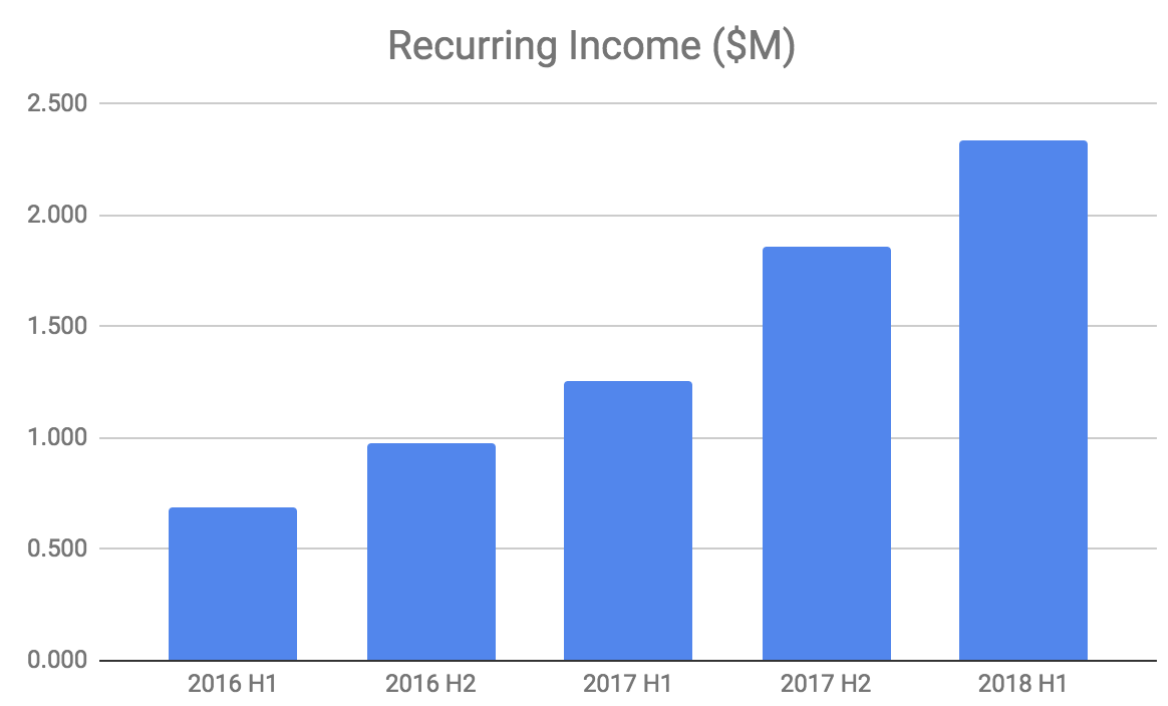
Since 2012 Windlab has been maintaining an equity interest in some of its projects beyond the development phase. It has done this primarily by converting some of the development margin it earns into equity rather than receiving all cash on financial close of certain projects. Normally it receives a third of the development margin as cash with two thirds remaining invested depending on the attractiveness of the project. This generates a share of profit once a farm is operational following construction (which usually takes 12 to 24 months), and makes up part of the recurring income base in the chart above.
The other main contributor to recurring income is asset management fees earned during construction and when the project is operational. Importantly these are independent of wholesale energy prices which affect project profits. The company aims to provide asset management services for its own projects as well as on behalf of third parties. Unlike profit share, this element of recurring income also has an associated cost. Historically, gross margins have been slim although improving; 10% in 2016 rising to 20% in 2017. In the first half of 2018, asset management fees made up 61% of recurring income. This is likely to fall as more company owned projects come online.
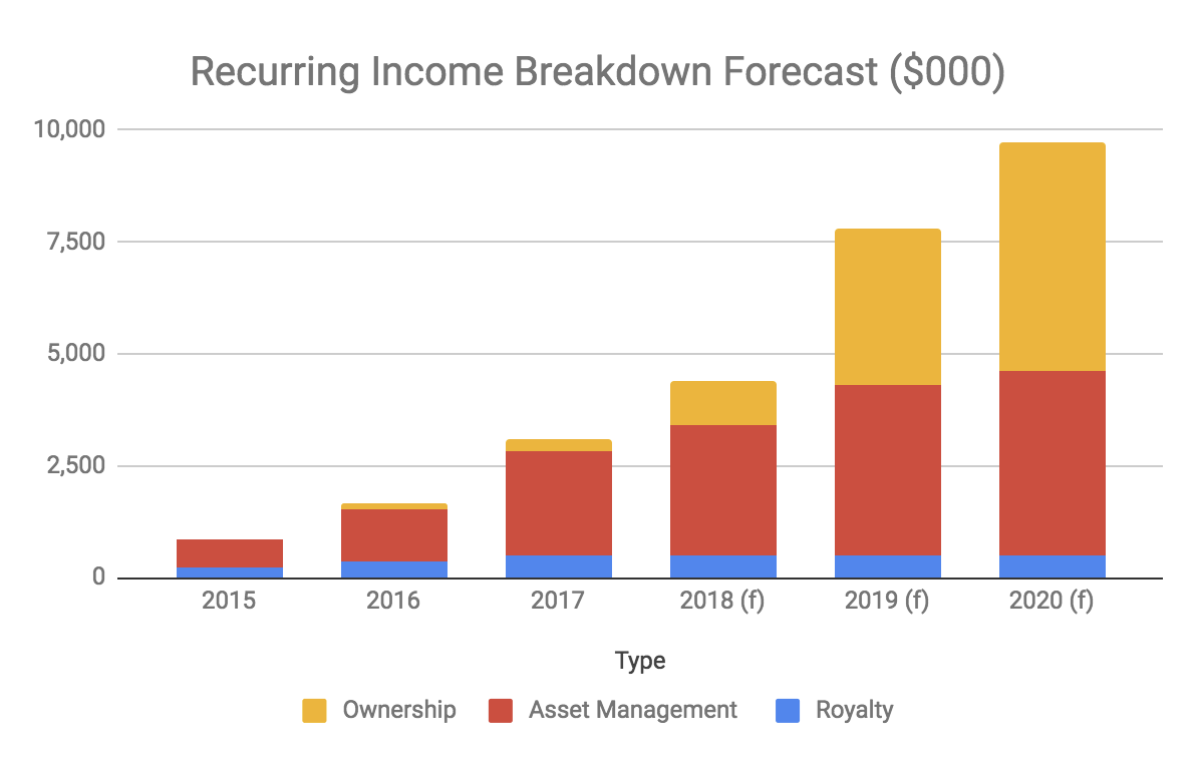
The chart above is based on my guesstimate of how recurring income may evolve over the next couple of years. It has been crudely constructed based on incomplete information and includes contributions from only a handful of Windlab’s ongoing projects. These are West Coast One, Coonooer Bridge, Ararat, Kiata, Kennedy Phase 1 and Lakeland.
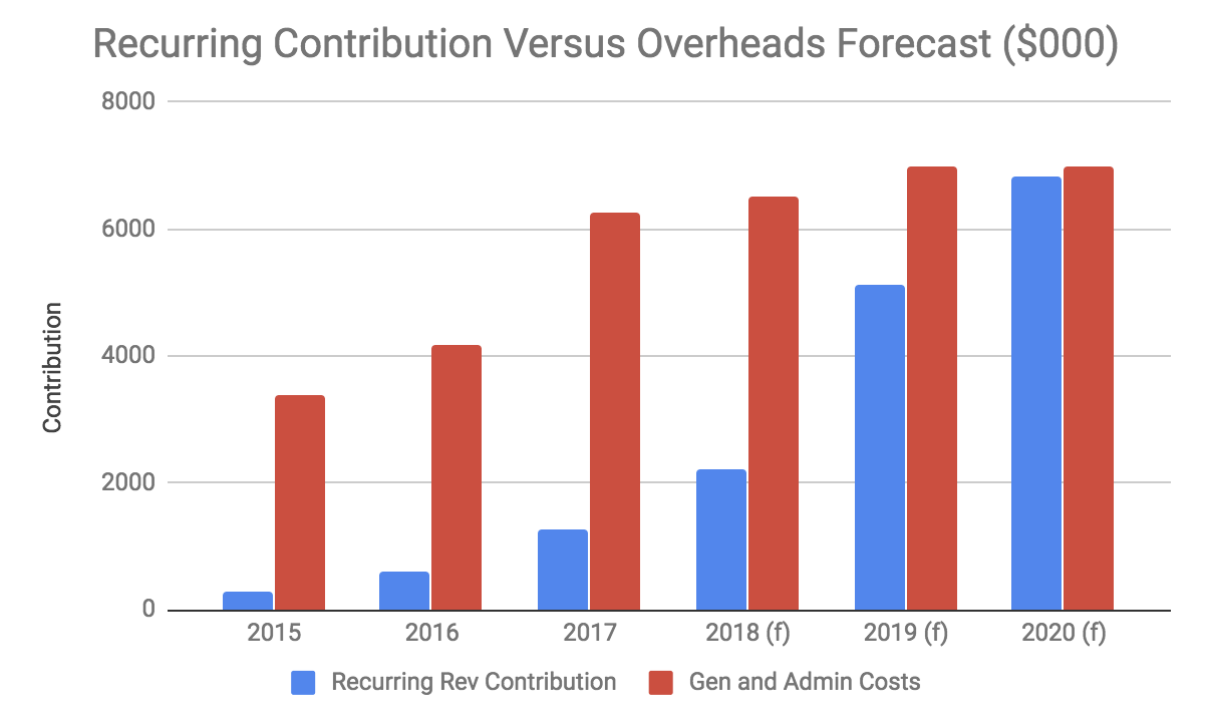
This chart uses the same imprecise data and adjusts for cost of sales associated with asset management revenue (contribution) to give a sense of when the company may become profitable on a recurring income basis. It assumes gross margin will improve to 25% in 2018 and again to 30% in 2019 and 2020; and that overheads will rise to $7 million and then remain steady.
A Robust Strategy
Windlab’s business is built upon its superior ability to prospect for wind projects due to its proprietary software, Windscape. Originally developed at CSIRO, Windscape can be used “to map vast areas of any country for wind speed, time of day and direction at a resolution of 100 square meters or better”. This is superior to the conventional approach to prospecting of using wind maps which have a resolution of between three and ten kilometres.
The following chart demonstrates how this technology ultimately translates into a competitive advantage for Windlab.
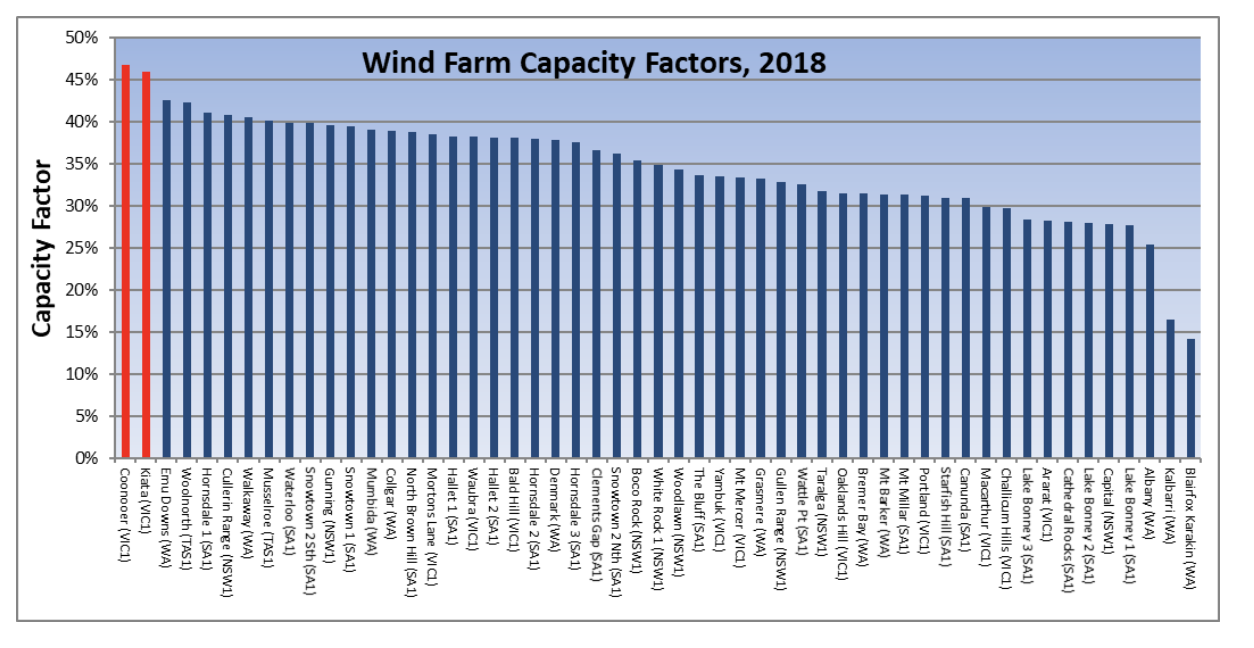
Capacity factor is an efficiency measure which compares the average power generated by a wind farm with the rated peak power of the wind turbines. Windlab developed the top two performing wind farms by capacity factor in Australia in 2018, Coonooer Bridge and Kiata (the red, above).
Superior intellectual property does not necessarily translate into a valuable business but in our opinion Windlab’s management are well on the way to achieving this. The company has progressively moved up the value chain from consultancy, to development and more recently to operations and ownership. As highlighted previously, this reduces the risk of relying on lumpy on-off development margins which can dry up during times of industry turmoil.
By converting development margin into ownership interest Windlab also leverages its investment in a project. It initially invests between $2 million and $5 million over a number of years to develop a project. It then realises several times this amount upon financial close with 30% paid in cash which usually more than covers the original cost. It invests the remainder into the project which typically yields a minimum of at least 8%.
As a hypothetical example, assume Windlab develops a project costing $3 million. It then plans to realise seven times this amount at financial close: $21 million. It takes $6 million as cash, providing a 100% return on the original investment, and then invests $15 million at a 10% internal rate of return yielding approximately $1.5 million in recurring income. These are fantastic economics.
It doesn’t always work out like this though. Firstly, not all projects are going to reach financial close and it is too early to work out what proportion do, given Windlab has only developed a small number of projects so far. Also, development returns are not always so high. For example, Coonooer Bridge Wind Farm cost $2.5 million to develop and realised a development margin of $2.7 million in cash and a 16.3% equity interest which Windlab later sold down to 3.5% for $2 million.
As well as being vertically integrated, Windlab’s business is geographically diversified with a growing number of projects underway in Sub-Saharan Africa, key projects in Australia and a small number in North America. Africa poses additional financial risks so the company looks to exit projects completely at financial close, rather than retain an equity interest (in most cases). The continent is potentially a highly rewarding place to do business due to rising incomes and poor energy coverage. The provision of renewable energy with its low operating expenditures can help these countries provide lower cost electricity, in the long term.
Within Australia, management has been savvy in targeting North Queensland to develop its main projects. In Queensland most energy is generated in the south east and so the Queensland Government currently subsidises the additional cost of supplying energy to the rest of the state through the Community Service Obligation (CSO). The total cost of the CSO in 2015/16 was $498.4 million. Windlab will help to reduce this cost through its Lakeland and Kennedy projects.
Queensland is also desirable because most of its energy is generated by aging coal power stations that will need replacing in coming years regardless of the fact they are bad for the environment. It also has excellent solar assets combined with scarce wind resources in close proximity to the electricity network which plays to Windlab’s strengths. Unlike wind, solar does not generate power at night and so the two are complementary and Windlab has the ability to identify and best exploit the wind resources that do exist.
Big Kennedy: A Big Deal?
The Kennedy project is a two phase project in North Queensland. The first phase is a 58 MW hybrid solar, wind and battery project 50% owned by Windlab and currently under construction. Proceeds from last year’s IPO of around $25 million have been primarily used to retain a joint interest in Kennedy Phase 1. The combination of wind, solar and battery power is a novel approach which aims to address the well publicised inability for renewable projects to provide base load power due to fluctuations in output.
If Kennedy Phase 1 is successful then there is a good chance that the 100% Windlab owned 1,200 MW Kennedy Phase 2 will be developed which will have a similar design. If this happens then the financial consequences for Windlab will dwarf those of any project that the company has previously been involved in. The company aims to earn a development margin of $250 thousand per MW which it has achieved in recent years earning margins of $260 thousand per MW from Coonooer Bridge in 2015 and $490 thousand per MW from Kiata in 2016. We don’t know if a similar development margin would apply to Kennedy Phase 2 but if so, achieving financial close on this project alone would make Windlab’s current market capitalisation of under $100 million appear attractive.
There are good signs that the project will proceed though the timescale is unclear. Firstly, in June 2017 the Queensland Government unveiled its “Powering North Queensland Plan” which includes a proposal to build a 500km transmission line that would connect to Kennedy Phase 2. However, it has only committed to providing equity funding for 30% of the project to date.
Secondly, upon signing an offtake agreement for Kennedy Phase 1 with Queensland Government owned CS Energy, Windlab announced that it had also “entered into a priority offer arrangement which affords CS Energy a first right of offer to negotiate a contract to purchase some or all of the electricity, LGCs, or other green benefits generated by Kennedy Phase II”.
Regulation and Other Risks
Regulatory uncertainty caused by government inaction or flip-flopping has the potential to derail the nascent renewable energy industry. This is no more apparent than in South Africa where the company holds a number of projects.
The Renewable Energy Independent Power Producer Procurement Program (REIPPPP) is the process by which renewable energy projects are provided with offtake agreements in South Africa. Following a number of successful rounds, the state utility company Eskom has effectively halted the progress of the REIPPPP by refusing to sign new purchase price agreements (PPAs) until the government gives it more control over price negotiations during the process. In 2016 Windlab impaired all of its South African projects to zero recording a charge of over $4 million due to this impasse which remains in force today.
There is the potential for trouble here in Australia too. The renewable sector has received heavy investment in recent years in large part thanks to a government scheme called the Renewable Energy Target (RET). The RET sets a target for Australia to source around 23.5% of its electricity demand to be from renewables by 2020. This is enforced in part through Large-scale Generation Certificates (LGCs) which can be created and then sold by accredited renewable power generators. The RET requires that an electricity retailer must buy the certificates to satisfy their renewable obligations each year or they get fined $93 per LGC for any shortfall.
Although the RET target peaks in 2020, it remains in place until 2030 which means that renewable energy producers will continue to earn additional revenue from the sale of LGCs until this time. The price of LGCs, which are traded in a secondary market, fluctuates and is likely to decline beyond 2020 as renewable projects continue to come onstream but demand from retailers remains static. The current price of an LGC is around $77 per MWh which is a lot given it is similar to the spot price of wholesale electricity.
If the price of LGCs falls significantly or if they are not replaced with an equivalent mechanism after 2030 then the attractiveness of investing in renewables diminishes. We think that it is likely that the scheme will not be replaced. However, it is also likely that historical subsidies of fossil fuel generators will also fall.
Countering this is the falling cost of building renewable projects due to greater efficiency from scale and technological advancements. In Windlab’s latest AGM presentation, it states that reliance on LGCs is no longer critical and although figures vary depending on the source, beyond 2030 (when the RET ends) it seems likely that renewable projects will be viable without any form of subsidy. This is likely in the absence of subsidy for competing technologies.
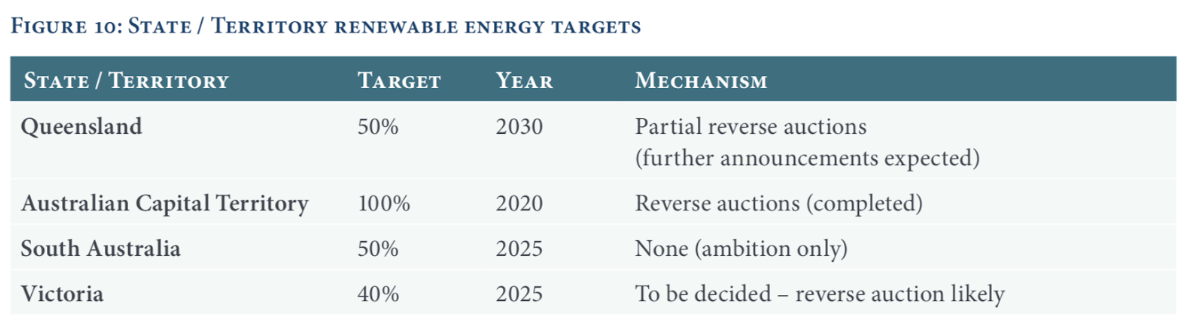
The renewable industry may also benefit from the fact that states have far more aggressive targets than those set by the RET and have the power to effectively bypass Federal Government by issuing PPAs for new projects.
There is also the issue of reliable base load power. It is true that renewables must be competitive on price after allowing for battery storage costs to ensure that energy is supplied to the grid when it is needed. Windlab’s Kennedy project is aims to solve this issue through a hybrid of wind, solar and battery storage. Further, as electric cars and smart metres gradually spread, there will be a degree of distributed power storage and demand side management. If we put an optimistic hat on, there is plenty of room for growth.
Another risk is the likely long-term deflationary impact on wholesale electricity spot prices given the incremental cost of generating renewable energy is close to zero. In my view this is something that will take many years to play out because of the way spot prices in the National Energy Market (NEM) are set.
Each energy supplier bids the quantity and price of their electricity in five minute intervals. The bids are then stacked by price in ascending order and matched with demand. The highest bid within the stack required to satisfy demand then sets the price for everyone. So it is the marginal bidder that sets the price.
Renewable providers can bid zero given their incremental cost of production is zero. Coal power stations also bid low because it is expensive for them to shutdown and restart production if their bids are not successful. Meanwhile, gas power stations bid the highest because they are relatively easy to shutdown and startup and gas is more expensive than coal.
Given the energy mix is dominated by fossil fuels today, it follows that fossil fuel power stations will remain the marginal bidder for many years. Ironically, it is actually good for owners of renewable energy projects if government policies delay the transition to renewable energy as it will ensure that prices remain higher for longer.
When renewables eventually dominate energy generation, we expect wholesale prices will reflect the cost to building and funding projects, thus eroding returns. We think there will always be value in identifying and designing the best projects, though. So if Windlab can maintain its competitive advantage then it should continue to realise healthy development margins.
Verdict
There is no doubt that Windlab is a risky company to invest in given all of the factors which lie outside of the company’s control. But with a project pipeline totalling more than 7,400 MW spanning dozens of projects and a strong financial track record it looks like it offers a decent risk reward profile to us at current prices. The stock is on my (Matt) watchlist and I may purchase a small parcel of shares in the future although not before five full trading days after this article is published.
Note from Claude: Matt did the vast majority of the work on this piece (though I assisted) and I am very proud to have it on Ethical Equities. I have followed Windlab for many years, including before it was listed publicly. I have spoken to the CEO and find him to be intelligent. I will wait five days after the publication of this report, and then I will consider buying a small amount of shares in this company. It is certainly hard to value but I consider it an interesting proposition and whether I do buy, or not, I will follow its journey.
For early access to our content, join the Ethical Equities Newsletter.
Disclosure: Neither Claude Walker nor Matt Brazier own shares in Windlab at the time of publication. This article contains general investment advice only (under AFSL 501223). Authorised by Claude Walker.