Dental aggregator 1300 Smiles announced a decent set of results today. Here are the highlights:
- Over-the-counter revenue up 9.6% to $55.8 million (this includes revenue earned by the self employed dentists that 1300 Smiles provides services to).
- Statutory revenue up 8.8% to $39.3 million
- Dividends up 4.3% to 24 cents or a trailing twelve month yield of 3.6% based on the current share price.
- Earnings-per-share (EPS) up 5% to 32.2 cents
- Net profit after tax (NPAT) up 5% to $7.6 million
- Free cash flow was $0.2 million compared to $3.6 million last year as the company ramped up its acquisition activity.
- Operating cash flow was up 18.2% to $10.4 million
- Net cash of $0.3 million
The following chart shows the relatively steady upward trajectory of the company over recent years barring the blip in 2013/2014 which was impacted by the withdrawal of the Chronic Disease Dental Scheme (CDDS). Note there is also a clear seasonality to the business with H1 typically stronger than H2. (Click image to view).

To be honest I’m a little disappointed with these results. I expected more growth given the company acquired five practices during the year on top of the five purchased in 2017.
The following chart shows the revenue contribution of the five acquisitions completed in 2018 split out from the total and the total revenue for 2017.
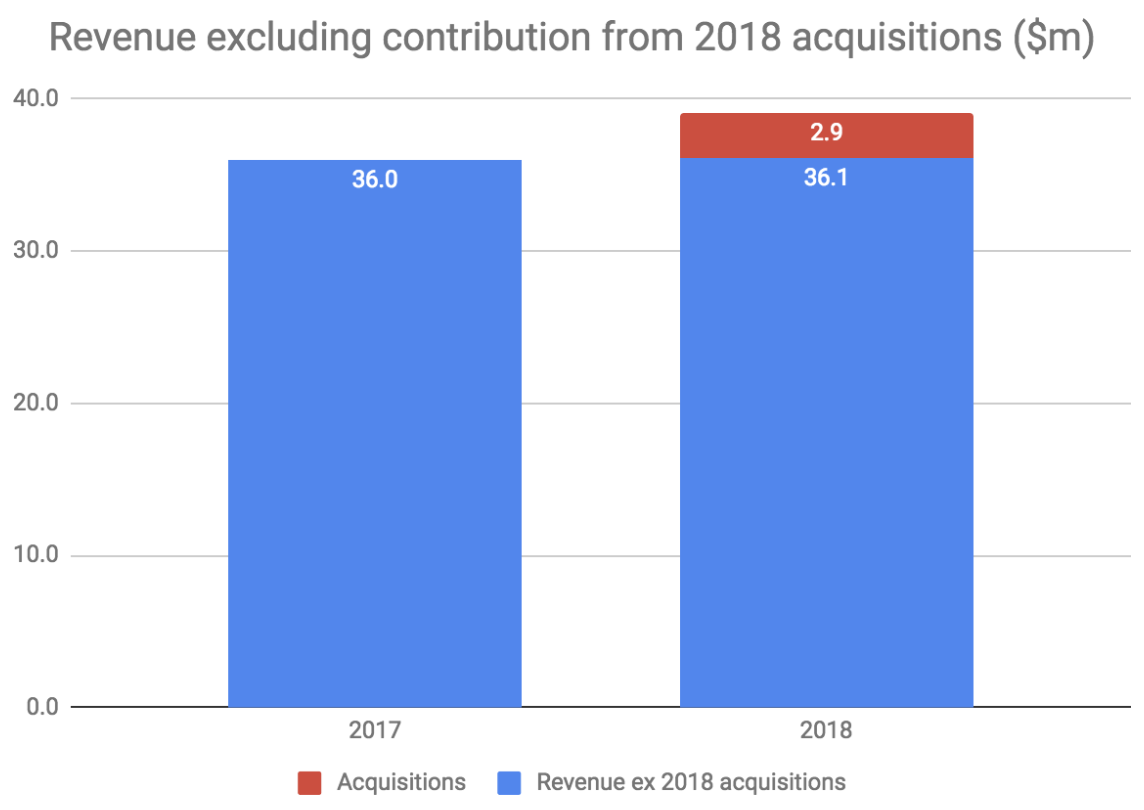
Clearly there is not much in the way of organic growth in 2018. In fact, the current year should have been boosted by the acquisitions made part way through 2017 so it looks as if the pre-existing business shrank. In particular, two orthodontists which settled on 30 June 2017 would have contributed nothing to 2017 and were expected to generate more than $2 million of revenues a year according to an ASX announcement dated 27 June 2017.
I would like to do a similar analysis for 2016/2017 but I can’t find a breakdown of the revenue contribution for the acquisitions completed in 2017 in the that year’s annual report.
I have some sympathy with the lack of organic growth. The company acquires when times are tough in order to take advantage of low prices and so it stands to reason that the group’s pre-existing businesses would also show some strain at these times. I expect organic growth to return as conditions improve and corporate activity tails off.
1300 Smiles remains a good quality business run by effective capital allocators as shown by the consistently high returns on capital it generates as per the following chart. Note the slump following the CDDS termination and recent declines on the back of the current acquisition spree.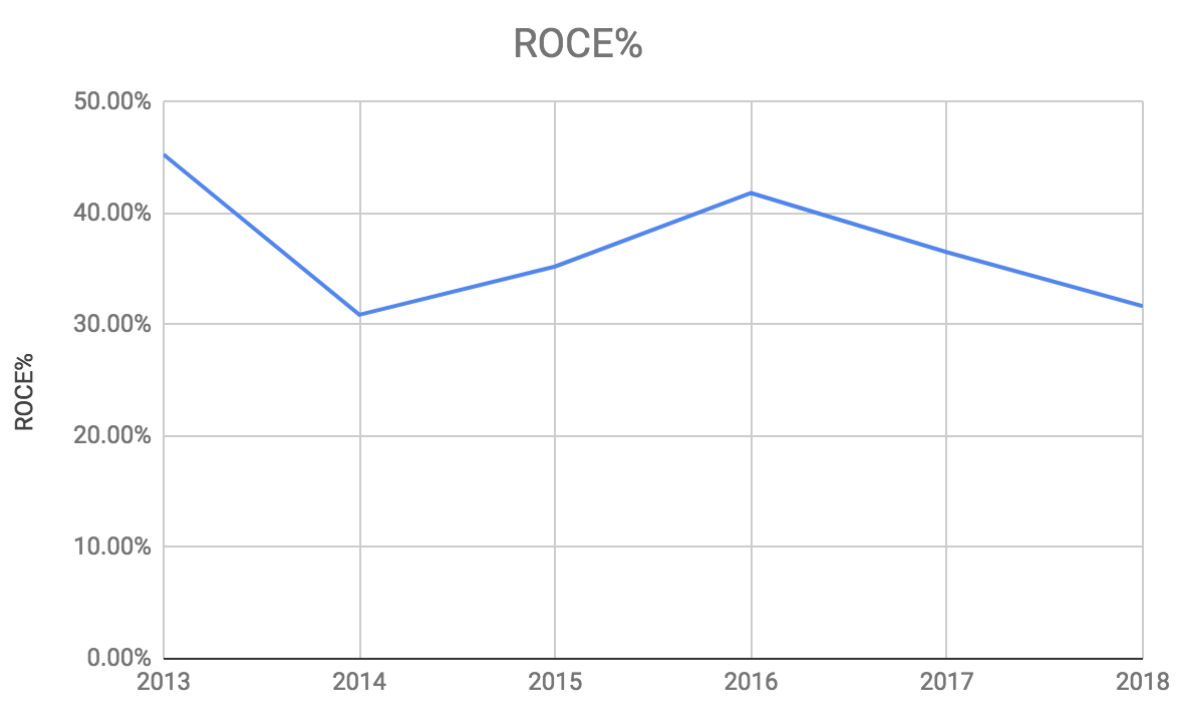
I define return on capital employed (ROCE%) as earnings before interest and tax (EBIT) divided by the average of opening and closing net assets less cash plus debt.
One are worth exploring is the joint venture in Dentist Members Australia (DMA) that was disposed in the year for $400,000. 1300 Smiles previously owned 33% of the company with two other unnamed equal owners (given it is a joint venture rather than a minority interest). Presumably one of the other shareholders is Daryl Holmes as DMA is listed as a related entity in the Directors Remuneration Report.
Dentist Members Australia offers a voucher system to help patients spread the cost of treatment into manageable chunks. The business generated $1.2 million of revenue in 2017 up 30% on 2016 and 1300 Smiles’ share of profit was $88,000. Although this is immaterial in the contexts of the groups current revenues and profits, it hints at a promising beginning for the venture and it would have been good to receive an explanation for the disposal from management.
The nature of the disposal was also noteworthy given it was done through a vendor finance loan provided by 1300 Smiles at a fixed interest rate of 2% compared with in excess of 5% for all of the other loans receivable to the company.
Perhaps I am nitpicking and the bigger picture is that I expect revenue and profit to grow in 2019. This is because of full-year contributions from 2018 acquisitions as well as the Noosa one completed in July 2018. Also, the nine chair facility recently opened in Morayfield should add revenue, if not profit.
At the same time there is the potential for the company to realise synergies from the recent acquisitions improving profit margins. With a PE (price-to-earnings) ratio of around 20 times, the stock looks fairly valued to me given its track record of growing through all types of business environments.
I own 1300 Smiles shares and will be holding for the time being but may sell if something better comes along (I will not sell for at least 2 full trading days following the publication of this article).
As for Claude, he informs me he is content with these results and will continue to hold his shares.
Join the Ethical Equities Newsletter.
The Author of this piece, Matt Brazier, owns shares in 1300 Smiles. Claude Walker owns shares in 1300 Smiles. This article contains general investment advice only (under AFSL 501223). Authorised by Claude Walker.


Hey Rick, I use 20% as a benchmark but there are exceptions eg lenders, infrastructure companies, insurers etc where there is either a regulatory requirement to hold a certain level of capital or the business is capital intensive but highly defensive so the optimum capital structure is debt heavy. In these cases return-on-equity (ROE) is typically better but to be honest I tend to steer clear of these types of businesses anyway since I find it either too hard to assess the risks (in the case of lenders/insurers) or growth prospects are limited (infrastructure).
Actually, I find it is usually more instructive to track change in ROCE over time, say 5 yr rolling periods (although this requires more work). This enables you to see how well management are allocating capital over time so you can tell if the business is improving (ROCE increasing) or deteriorating (ROCE decreasing). There is usually a lag between deployment of capital and returns which is why I suggest using rolling 5 yr calculations but again this will vary from business to business. The definition I use here is end of period EBIT less start of period EBIT divided by end of period capital (net assets less cash plus debt) less start of period capital. Often you can also get a sense of the trend just by looking at ROCE% over time as per the above chart which shows a bit of a slump in the last couple of years.
Sorry that's a bit of a long-winded answer!
Hey Matt, great post, thanks for the effort! I am interested in your methodology for calculating ROIC, when you say average of opening and closing net assets, do you mean net assets for PRP and Current FY?
LinkI have seen a lot of different formulas for calculating ROIC, I think its the "I" that is hard to break out!
I also look at Fixed assets + Working capital/EBIT as a % and have also used EBIT/EV as a proxy for ROIC.
Hi Ricky, no problems. What I do is take net assets less cash plus debt at the start of the period (ie for 1300SMILES 2018 results: 36,105 - 5,733 + 0 = 30,372) and at the end of the period (38,114 - 2,295 + 1,951 = 37,770) then take the average (34,071) then divide EBIT by this number (10,788/34,071 = 31.7%).
LinkI've seen other formulas too but have settled on this one as it makes sense to me but am sure others work just as well. I suppose the important thing is consistency when making comparisons. I like the above formula because it doesn't penalise companies that hold cash and it is easy to extract the inputs from the accounts. It can come unstuck when you have non-standard capital structures though.
Hi Matt,
LinkAny concerns about the lack of penetration in NSW?
Stanmore has already been sold, reducing number of surgeries to 4.
Waterloo could well go the same way.
I think the biggest flaw in their model is they acquire a practice from a dentist intending to retire in 5 years. Once the 5 years are up, a new grad replaces retiring dentist and years of experience are lost. It takes a long time for a new grad to generate the same fees.
Not held.
Hi Juan,
LinkSounds like you know the company better than I do! I do not have any specific concerns surrounding NSW penetration but agree that more generally their model doesn't seem to have been working for the last couple of years given organic growth has gone into reverse. I had thought that this was due to cyclical factors such as the mining downturn and an influx of capital into the sector as per DH's letters but perhaps the strategy is fundamentally flawed as you seem to be suggesting. I simply don't know.
I sold my shares today in favour of another investment that I think offers far more potential and won't be revisiting 1300SMILES unless there is a return to organic growth as a minimum.
Matt